Market View – July 2015
Posted by IFS on August 17, 2015
Australia
- The RBA left the official cash rate on hold in July and again in early August at 2%, as was widely anticipated by financial markets.
- In August, the RBA made a number of slight changes to its view of the Australian economy, once again highlighting its surprise at the strength in the labour market.
- The statement noted “In Australia, the available information suggests that the economy has continued to grow. While the rate of growth has been somewhat below longer-term averages, it has been associated with somewhat stronger growth of employment and a steady rate of unemployment over the past year.”
- This has led the RBA to question the reasons behind the strength in the recent labour market numbers, especially given prolonged below trend GDP growth.
- In a speech titled “Issues in Economic Policy” on 22 July 2015, Glenn Stevens noted that the better labour market outcomes could be due to four different factors; statistical noise in labour force data, the GDP data could be revised up, the slower wages growth could be the factor or potential trend growth is lower than expected.
- With this new thinking from the RBA and contained inflationary pressures the RBA noted that “in such circumstances, monetary policy needs to be accommodative”.
- The RBA also altered its commentary on the Australian dollar, noting “The Australian dollar is adjusting to the significant declines in key commodity prices.” This is compared to the July meeting where the RBA noted “further depreciation seems both likely and necessary, particularly given the significant declines in key commodity prices.” This change in language follows a 5% fall in the Australian dollar against the US dollar in July.
- Q2 2015 Consumer Price Inflation (CPI) data was released showing the headline CPI rose 0.7% per quarter and 1.5% per year. This was a small increase from 1.3% per year in Q1 2015 with most of the increase due to petrol prices which rose 12.2% per quarter. Underlying inflation, the RBA’s preferred measure rose on average 0.55% per quarter to 2.3% per year, slightly down from 2.35% in Q1 2015.
- Business confidence and conditions continued to show a positive rebound. The NAB Business Confidence Index rose to 10, from 8, higher than its long-term average of 6. The fall in the Australian dollar, which has now been in the $US0.70s since mid-January 2015 has helped this recovery.
- In contrast the Westpac Consumer Confidence Index fell 3.2% in July, following a 6.9% fall in June. Offshore concerns, particularly the protracted Greek debt crisis and volatility in the Chinese equity market have been weighing on consumer confidence.
- In contrast, the latest figures on retail sales showed a 0.7% per month increase in June 2015 and are now up 4.9% per year, driven by NSW which rose 1.0% per month and the Household Goods category which rose 2.2% per month, boosted by property prices in NSW.
- Australian house prices rose 2.8% in July, the fastest since records began in 1995 according to RPData-Rismark, this took annual house price growth to 11.1% per year. On a capital city basis Melbourne (+4.9%), Sydney (+3.3%), Brisbane (+0.4%) and Perth (+0.1%) all rose while Adelaide (-1.1%) fell.
United States
- The US Federal Open Market Committee (FOMC) met on 28-29 July 2015 and as widely expected, held the Fed Funds target rate at 0%-0.25%.
- The statement released by the Fed was little changed from the June statement, but with the addition of some important language changes. At this stage the Fed considers progress on the economy towards its dual mandate as continuing.
- Importantly the significant change to the statement was in this section “The Committee anticipates that it will be appropriate to raise the target range for the federal funds rate when it has seen some further improvement in the labour market and is reasonably confident that inflation will move back to its 2% objective over the medium term.”
- The Fed only now needs to see some improvement in the labour market rather than further improvement as was the case in June and suggests they are closer to the first lift off date. Attention is on the timing of the first interest rate hike, currently expected this year, with most commentators debating if it means September or December 2015.
- On employment, there were further positive signs in the month with 223,000 jobs added in the month of June. The unemployment rate fell to 5.3% from 5.5% with the total number of jobs added over the past 12 months now 2.935mn.
- Despite strong job gains, wages growth has largely been non-existent. Average Hourly Earnings was flat in June and 2.0% per year, while the Employment Cost Index (ECI), which had been showing signs of acceleration also retreated. Q2 2015 ECI rose just 0.2% per quarter, the smallest gain since 1982 when the data begun. This took annual gains to 2.1% per year, down from 2.6% per year.
- The first estimate of Q2 2015 GDP was released at 2.3% on a seasonally-adjusted-annualised-rate, up from a revised 0.6% in Q1 2015 (was -0.2%). Growth in Q2 was driven by improvements in consumer spending while weak business investment and government spending was the laggards.
- Inflation also remains subdued. Headline inflation rose 0.3% per month in June to be up 0.1% for 12 months. Core CPI (ex food and energy) is 1.8% per year and the Fed’s preferred measure of underlying inflation, the Core Personal Consumption Expenditure, was 1.3% per year stable from May.
- The US Dollar Spot Index rose 1.9% in July and has now risen 19.5% over 12 months
Europe
- The European Central Bank (ECB) met on 16 July 2015 didn’t announce any policy changes.
- The focus in the first-half of the month were the protracted negotiations with Greece which in the short-term were largely resolved with the release of a Euro Summit statement and as the Greek parliament passed two different legislations through parliament as a precondition to commencing official negotiations for a third-bailout package worth €86bn. These negotiations are expected to be concluded by 20 August 2015.
- As a result the ECB increased its Emergency Liquidity Assistance (ELA) for the Greek banks, allowing them to reopen, albeit with a weekly withdrawal limit of €420.
- Elsewhere in Europe, the ECB released details of its monthly asset purchases with €61.3bn in July, ahead of schedule of €60bn, with its public sector purchases at €51.3bn, with the ECB, ahead of schedule of €50bn before the summer slowdown in August.
United Kingdom
- The Bank of England (BoE) left policy unchanged at its 9 July 2015 meeting, as expected. The Bank Rate was unchanged at 0.5% and the stock of asset purchases remained at £375bn. Some members of the BoE over the month detailed that the decision was becoming more finely balanced and that a rate hike near the turn of the year could be appropriate.
- The advance estimate of Q2 2015 GDP was 0.7% per quarter and 2.6% per year, slightly lower than the 2.9% per year in Q1 2015. Both business services, finance and North Sea oil output helped growth in the quarter.
Japan
- The Bank of Japan's (BoJ) policy board convened on 15 July 2015 and left its qualitative and quantitative easing (QQE) program at an annual increase of ¥80trillion to its monetary base.
- Inflation data remained subdued, headline inflation was just 0.4% per year in June, down from 0.5% per year in May. Core CPI (ex food ex energy) was 0.6%. This remains substantially below the BoJ target for 2% inflation around September 2016 and continues to raise the possibility of further action by the BoJ. Wages tumbled in June, down 2.4% per year, compared to +0.7% per year in May with a change to the timing of bonus payments the reason.
Australian dollar
- The Australian dollar moved lower against all major cross currencies in July, helped lower by sharp falls in commodity prices, with moves against the US dollar the largest. The Australian dollar fell 5.2% against the US dollar to $US0.7308 and is now well below its 10-year average ($US0.88) and its post-float average of $US0.76.
- The Australian dollar also fell against the Sterling (-4.7%), the Euro (-3.9%), the Japanese yen (-4.1%) and the New Zealand dollar (-2.7%).
AUSTRALIAN DOLLAR DOWN SHARPLY
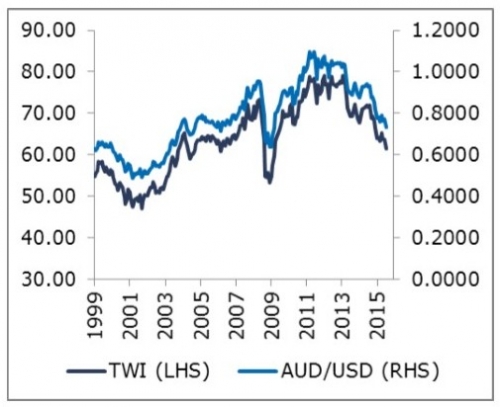
Source: Bloomberg as at 31 July 2015
Commodities
- Commodity prices fell sharply in July, weighed down by volatility in the Chinese equity market, escalating concerns of a weakening demand profile and a supply overhang. As a result commodities heavily linked to China fell the most; oil, copper and iron ore.
- The Brent crude oil price fell 20.8% to $US47.1 / barrel. The signing of the long-awaited nuclear non-proliferation with Iran led to assumptions of a ramp of oil supply from the country if oil trade sanctions are reduced or removed.
- The iron ore price, as measured by the benchmark price of iron ore delivered to Qingdao China – 62% Ferrous Content fell 10% to $US53 a metric tonne.
- Metal prices (apart from tin +17%) were weak led by copper (-9.3%), nickel (-7.8%) and zinc (-4.2%).
- The gold price also fell, down 6.5% in July to $US1096 an ounce, the lowest price in five years.
IRON ORE PRICE WEAKER
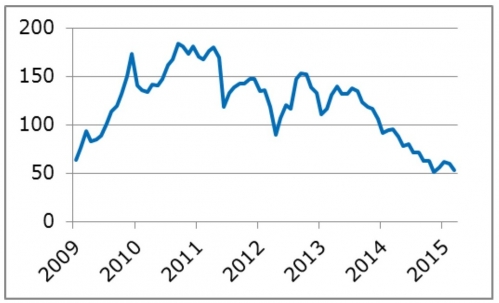
Source: Bloomberg as at 31 July 2015
GOLD LOWEST IN FIVE YEARS
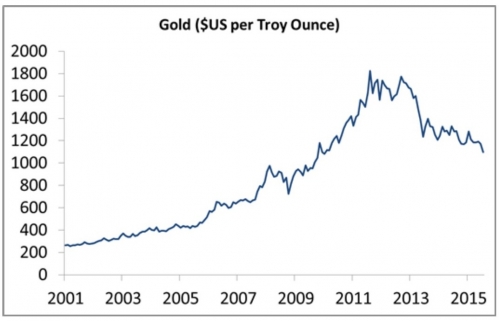
Source: Bloomberg as at 31 July 2015
Australian equities
- Australian shares rebounded strongly from their June weakness, with the S&P/ASX 200 Accumulation Index adding 4.4%.
- Defensive yield stocks – including Health Care and Consumer Staples – were typically among the best performers, reflecting a significant drop in bond yields globally.
- There was a fair amount of scrutiny on capital requirements in the banking sector and possible recommendations from the regulator, APRA. Three of the ‘big four’ lenders increased borrowing costs on mortgages for property investors in an effort to dampen loan growth in that segment.
- The Materials sector was the only area of the market not to register gains. Commodity prices resumed their downward trend, with oil and iron ore closing the month ~20% and ~10% lower respectively.
- All attention has now shifted to the ‘reporting season’. During August, most ASX-listed companies will release their earnings for the six or 12 months ending 30 June 2015. Investors will be keeping a close eye on the tone of outlook statements as well as the financial results themselves.
Listed property
- A-REITs benefited from investors’ focus on defensive yield stocks in July. The S&P/ASX 200 Property Accumulation Index enjoyed a strong start to the new financial year, adding 5.7%.
- The effect of currency movements was reflected in the performance of individual stocks. Westfield Group (+10.0%), and other stocks which derive a meaningful proportion of their earnings offshore, benefited from further weakness in the Australian dollar.
- Other retail-oriented stocks including Scentre Group (+5.6%) were supported by data that reaffirmed healthy conditions for non-discretionary retail sales.
- There remained a fair amount of corporate activity in the sector. The most significant deal was the sale of a portfolio of office assets by Investa Office Fund (+4.2%) to China-based CIC. The sale was reported to be worth around $2.5 billion.
- In aggregate, Australian property securities continue to offer investors healthy dividends. The FY16 dividend yield of 4.9% is slightly higher than that of the broader Australian share market.
- Offshore property securities also registered gains in July, with the UBS Global Property Investors' Index rising 3.5% in USD terms. The UK (+6.1%) was the top performing region, closely followed by Continental Europe (+6.0%). On the negative side, the Singapore market (-6.6%) was a notable underperformer.
Global developed market equities
- Global developed equity markets were predominantly stronger in July, post a resolution to the Greek debt crisis and as markets remained sceptical the US Federal Reserve will begin lifting interest rates in September. Government bond yields traded lower in the month, boosting demand for yield stocks in particular. All major markets apart from Canada, Hong Kong and Singapore recorded positive gains.
- It was Q2 2015 earnings season over the month and especially in the US most earnings releases hinted at positive surprises. At the time of writing 74% of S&P500 companies had beaten earnings estimates, although only 49% beat sales estimates. In Europe, 64% of companies that had reported beat earnings estimates, the highest since data started to be kept in 2009. In Japan, 60% of the Topix companies that have reported beat earnings expectations and 58% beat sales expectations.
- The Chicago Board Options Exchange SPX Volatility Index, a market estimate of future volatility, spiked at 20 on 9 July at the height of the Greek debt crisis before falling to 12 at the end of the month.
- Overall the MSCI World Index rose 1.7% in USD terms after falling 2.5% in June. The Index rose 7.2% in AUD terms given the 5% depreciation against the US dollar in the month.
- The S&P 500 Index rose 2% in the month, the Dow Jones was up 0.4% and the NASDAQ rose 2.8%. MSCI Energy (-6.2%) and MSCI Materials (-4.9%) fell heavily in the month given weakness in the oil price and the metal space.
- Equity markets in Europe were stronger on the near-term resolution of the Greek debt crisis, although implementation risks remain. The German DAX rose 3.3% in July, France was up 6.1%, Spain was +3.8% and Italy was +4.8%. The UK FTSE 100 was up 2.7% for the month.
- The Athens Stock Exchange was closed for the month of July and reopened on 3 August 2015.
- In Asia, the Japanese Nikkei 225 rose 1.7% over the month while Hong Kong (-6.1%) recorded sizeable losses given the volatility on the various mainland Chinese equity indices. Singapore also retreated, down 3.5% for the month of July.
EQUITY MARKETS MIXED
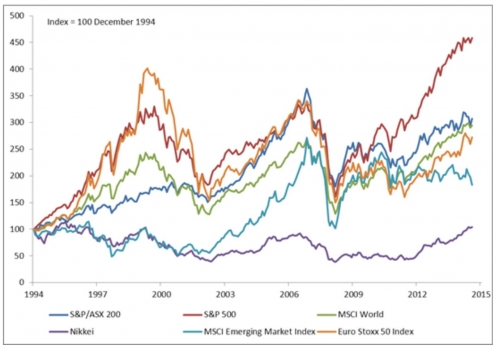
Source: Bloomberg as at 31 July 2015
Global emerging markets
- Emerging market (EM) equities fell sharply in July, down 6.9%, taking the losses over three months to 12.8%, in US dollar terms. The MSCI Emerging Markets Index continued to underperform the broader developed market index with concerns focussed on US dollar strength and the first interest rate rise in the US, weakening commodity prices and the equity market volatility in China.
- The Shanghai Composite Index lost 14.3% in July with most of the losses early in the month prior to a range of measures being introduced to reduce volatility. Markets in Latin America also weakened on commodity price falls. The Ibovespa Brasil Sao Paulo Stock Exchange Index fell 4.2% as the Banco Central do Brasil lifted the official SELIC rate to a 9-year high of 14.25%, the sixth rate hike this cycle. The central bank suggested this was the last rate hike.
© Colonial First State Investments Limited ABN 98 002 348 352 AFS Licence 232468.
This document has been prepared by Colonial First State Investments Limited ABN 98 002 348 352, AFS Licence 232468 (Colonial First State) based on its understanding of current regulatory requirements and laws as at 3 July 2015. This document is not advice and provides information only. It does not take into account your individual objectives, financial situation or needs. You should read the relevant Product Disclosure Statement available from the product issuer carefully and assess whether the information is appropriate for you and consider talking to a financial adviser before making an investment decision.
Comments
